

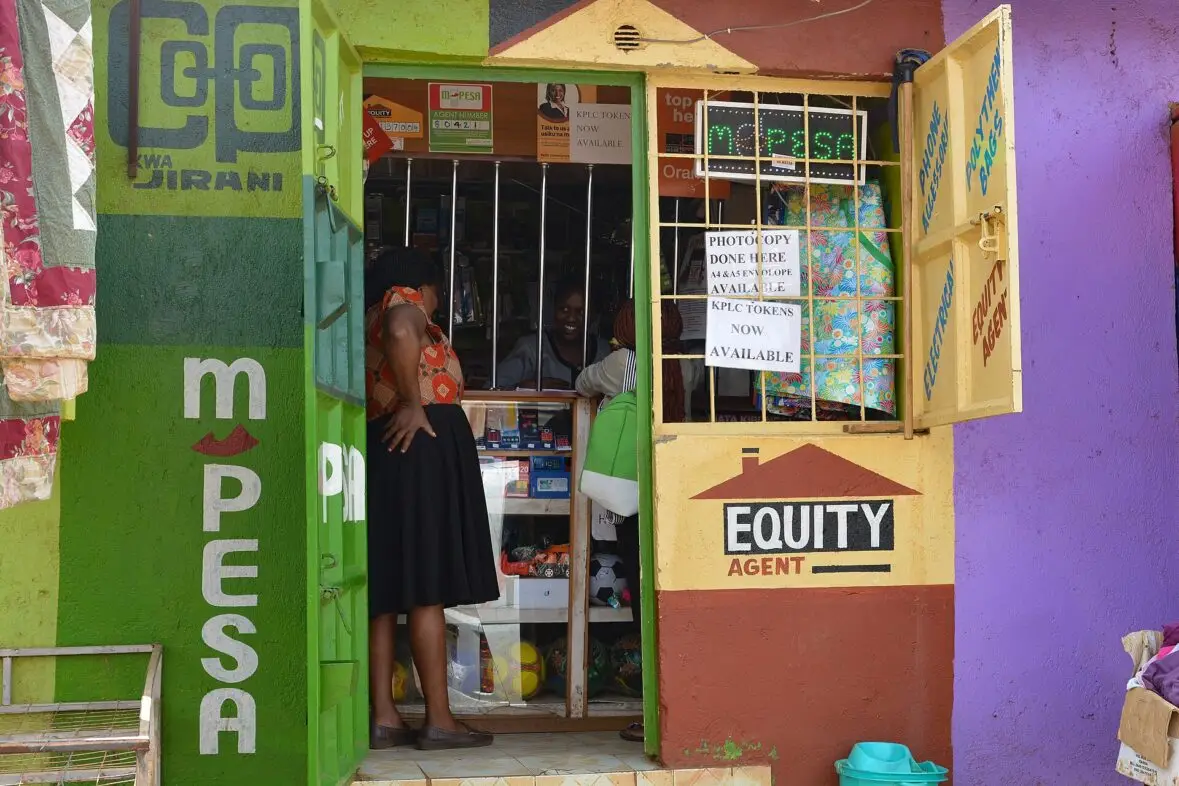
Remittance costs shift a lot with the way you send. Sending $200 home costs $9.18 on a fully digital service and $14.60 on a non-digital one. Those are TIME AFRICA dollar conversions of the averages in IFAD’s Sending Money Home 2026, published in September. Also, US senders who fund a transfer with cash face a 1 percent federal tax. On $200, that adds $2.00, by TIME AFRICA arithmetic. You control more of the final price than you think.
The remittance costs ladder
IFAD is the UN’s International Fund for Agricultural Development. It tracks the average cost of sending $200. Its report puts fully digital services at 4.59 percent in the third quarter of 2025, against 7.3 percent for non-digital services. As a result, IFAD says digital transfers cost 37 percent less. Both averages are global, so they do not describe Africa alone.
“Fully digital” has a precise meaning. The money is funded and received through digital instruments, with no cash at either end.
The World Bank adds provider types. Its Remittance Prices Worldwide database put banks at 14.55 percent, mobile operators at 4.97 percent and money transfer operators at 5.04 percent in the first quarter of 2025. Those are global averages too, and they are older than the IFAD figures. Read the table as a map, and check each source line.
| Rung | Average cost of sending $200 | On $200 | Source and date |
|---|---|---|---|
| Fully digital service | 4.59% | $9.18 | IFAD, Q3 2025, global |
| Mobile operators | 4.97% | $9.94 | World Bank, Q1 2025, global |
| Africa, non-bank services | 7.2% | $14.40 | IFAD, Q3 2025 |
| Non-digital service | 7.3% | $14.60 | IFAD, Q3 2025, global |
| Banks | 14.55% | $29.10 | World Bank, Q1 2025, global |
The dollar column is TIME AFRICA arithmetic. However, IFAD’s Africa figure of 7.2 percent covers non-bank services only. It has fallen from 9 percent in the third quarter of 2016.
What the gap in remittance costs is worth
The gap between non-digital and fully digital is 2.71 percentage points. That is $5.42 on $200. Send $200 every month, and as a result the gap reaches $65.04 a year, by TIME AFRICA arithmetic.
The benchmark is also low. AllAfrica, summarising IFAD’s findings, reports that the average regular remittance is now $400 to $450, up from $200 ten years ago. TIME AFRICA found no percentage for larger sends. So price your real amount with the provider.
The new 1 percent US tax
Section 4475 of the US Internal Revenue Code taxes certain remittance transfers at 1 percent when they occur after 2025. The Treasury’s proposed rule, published in the Federal Register on 13 April 2026, says the sender pays and the provider collects. Cash, money orders and cashier’s checks are taxed, and the proposal also adds traveler’s checks. The IRS lists the tax as No. 155 in its Form 720 instructions.
However, transfers funded from certain bank accounts or with a US-issued debit or credit card are exempt. The proposed rule also leaves ACH transfers and personal checks paid directly to the provider untaxed. Comments closed on 12 June 2026. Still, the rules remain proposed. IRS Notice 2026-52 extends penalty relief for providers and says the rules are being finalized, so details could change. This piece is information, not tax advice. It covers US senders only.
For example, on $200 the tax is $2.00. A non-digital send paid in cash then costs 8.30 percent, or $16.60. Then, against the fully digital $9.18, the gap grows to $7.42. Over twelve monthly sends, that adds up to $89.04. All of it is TIME AFRICA arithmetic.
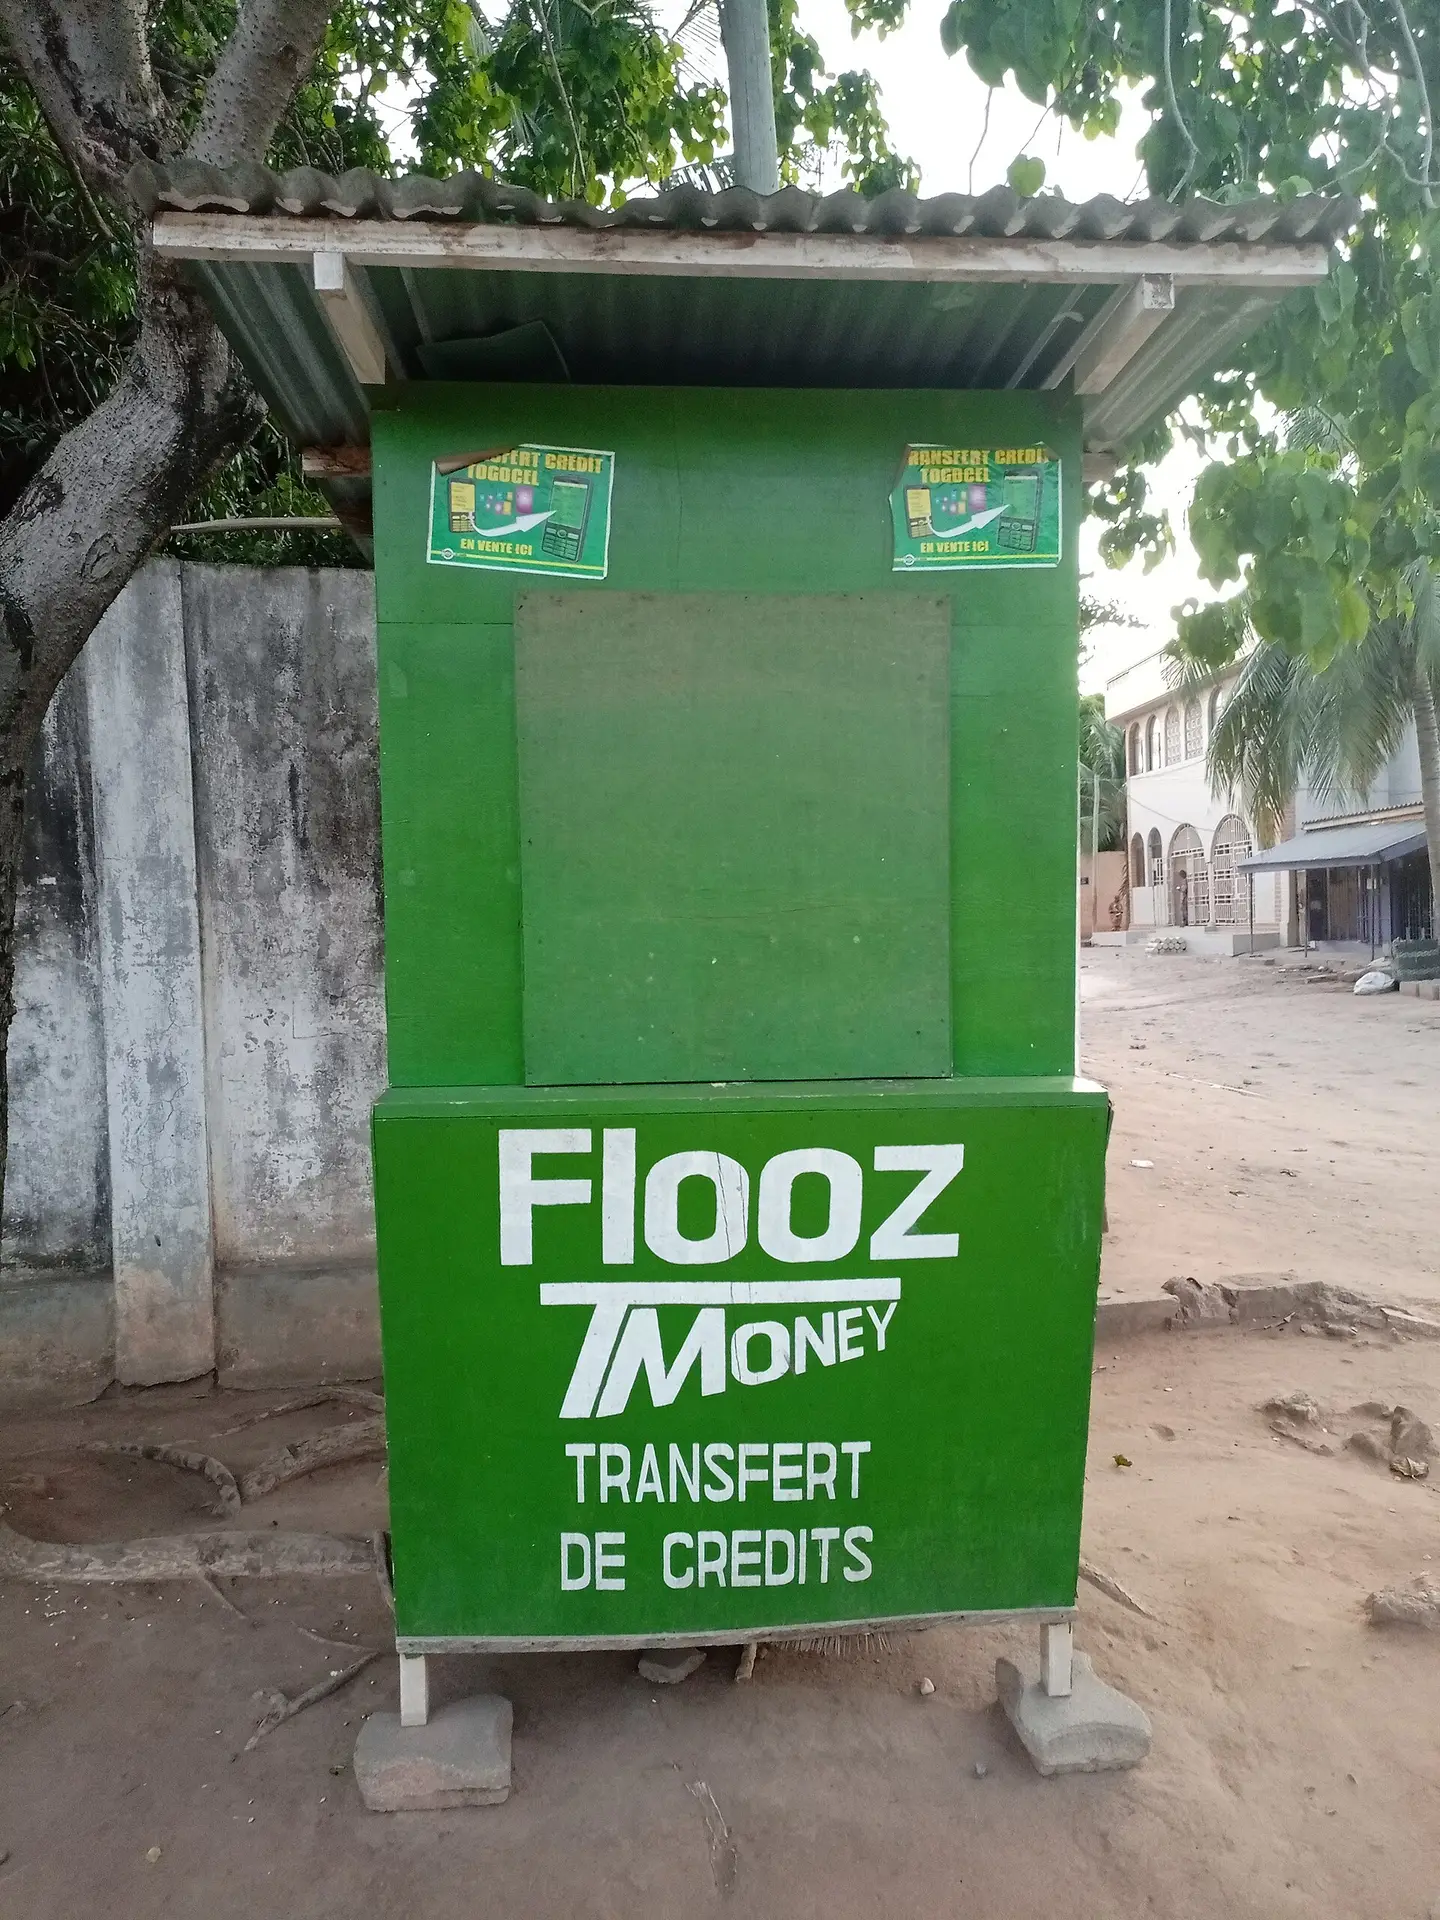
Where the money lands changes remittance costs
IFAD’s third-quarter 2025 figures show how much the receiving region changes remittance costs. Non-bank sends to Western Africa averaged 4.9 percent. Meanwhile, Eastern Africa came in at 7.2 percent, Northern Africa at 7.3 percent and Central Africa at 9.7 percent. Southern Africa, however, cost the most, at 10.4 percent. From West to South, the spread is 5.5 points, or $11.00 on $200. In fact, that is double the digital gap. Senders rarely pick the destination, so the way you send is the lever you hold.
What it means for the AfroNouveau sender
AfroNouveau is TIME AFRICA’s name for a global cultural identity bound by consciousness, not geography. It also includes Africans, the diaspora and people of African heritage. For many of them, a remittance is household finance across a border. For the wider picture of how the diaspora invests at home, read our piece on diaspora-led initiatives.

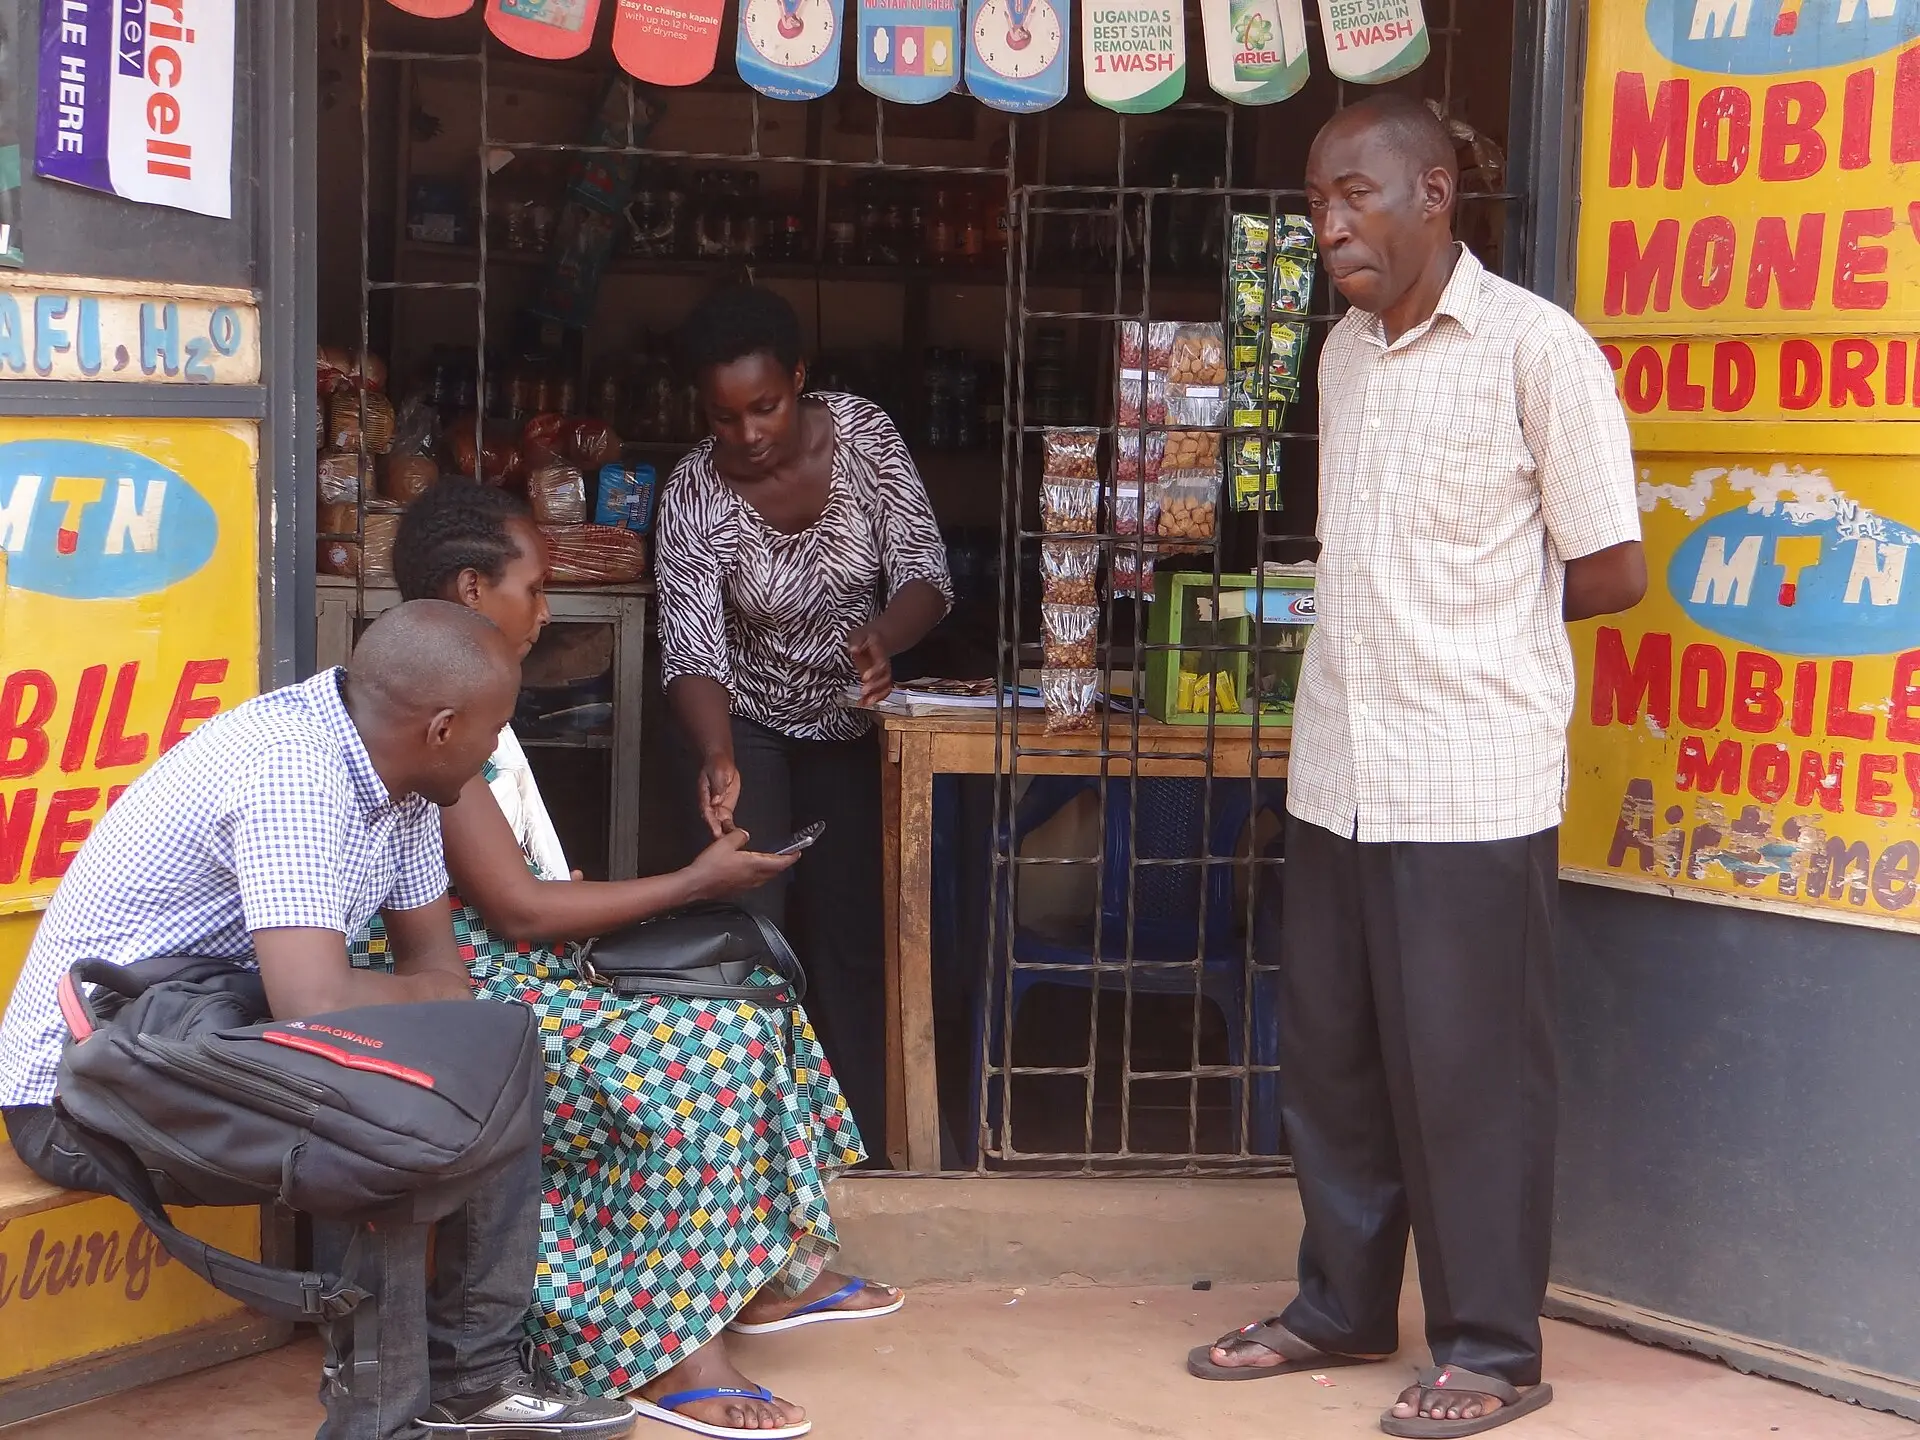
First, check the receiving end. A card payment that ends in a cash pickup is not digital at both ends, so it sits on the 7.3 percent rung. That is a TIME AFRICA inference from IFAD’s definition. If your family can take the money in a mobile wallet or a bank account, you may move down a rung without changing the amount. Ask your provider how it classifies the route.
Then price the year. Multiply your remittance costs for one send by the number of sends. Because of that, no single fee on a screen shows that total. Repeated costs matter most, a point we make in The Difference Between Building Wealth and Building Someone Else’s.
Check remittance costs before you send
- Fund the transfer from a bank account or a US-issued card if you can, since cash and similar instruments carry the 1 percent under the proposed rule.
- Ask for the amount your recipient will receive in local currency before you confirm. Price figures count fees and currency conversion together, so a low headline fee can hide a weak exchange rate.
- Ask whether the route is digital at both ends.
- Price your real amount, because the published averages use $200.
- Look again in a few months, since the regulations could change.
The distance to 3 percent
The UN’s Sustainable Development Goal 10.c calls for an average cost below 3 percent and no corridor above 5 percent by 2030. Meanwhile, IFAD puts the global average at 6.4 percent. Even so, the cheapest rung on the ladder, at 4.59 percent, still sits 1.59 percentage points above the target. The open question is whether the rungs will converge by 2030, and what each month of high remittance costs takes from the families paying the difference.
All stats are verified and cited.